


If you need a short answer: in 2026, WordPress/WooCommerce developer pay varies heavily by country, seniority, and local market. In most markets, WooCommerce work is priced in the upper part of WordPress salary bands because ecommerce projects include checkout, payments, integrations, and revenue risk.
This guide gives a practical benchmark by country and region, then shows how to use that benchmark in a make-vs-buy hiring decision.
Table of Contents
Quick Takeaways
- Salary bands vary a lot by market, but WooCommerce-heavy roles usually sit above general WordPress roles.
- Senior compensation is mostly driven by business-critical ownership (checkout, subscriptions, ERP/CRM integration), not years alone.
- Location still matters, but hiring speed and attrition can change your real yearly cost more than base salary.
- A reliable decision needs total cost modeling, not salary-only comparison.
Salary Benchmark by Country (Entry, Mid, Senior)
Important: sources use different methodologies (entry/experienced, percentiles, or low/high ranges). Use these numbers as directional planning benchmarks, not payroll policy.
| Country | Entry level | Mid level | Senior level | Source mapping |
|---|---|---|---|---|
| United States | $73,125 | $95,850 | $125,000 | Talent.com entry / average / most experienced |
| United Kingdom | GBP 52,500 | GBP 60,000 | GBP 75,500 | Talent.com entry / average / most experienced |
| Canada | C$58,500 | C$78,000 | C$114,563 | Talent.com entry / average / most experienced |
| Germany | EUR 27,500 | EUR 65,000 | EUR 80,000 | GermanTechJobs bottom 10% / median / top 10% |
| France | EUR 38,000 | EUR 48,000 | EUR 63,800 | DevITJobs bottom 10% / median / top 10% |
| Switzerland | CHF 85,000 | CHF 90,000 | CHF 100,000 | SwissDevJobs bottom 10% / median / top 10% |
| Ireland | EUR 33,362 | EUR 50,495 | EUR 76,430 | Indeed low / average / high |
Detailed Salary Comparison by Region (Total Cost of Employment)
Salary alone is not enough for planning. Generic multipliers are only a shortcut. A better approach is to split TCO into measurable components and anchor payroll burden in official datasets.
Model used in this section
For cross-country comparability:
Payroll TCO = Base salary / (1 - employer SSC share of labour costs)Employer SSC share comes from OECD Taxing Wages 2025 (Table 1.2, 2024 data, single worker at average wage).
Employer SSC share used (country data)
| Country | Employer SSC as % of labour costs (OECD) |
|---|---|
| United States | 7.5% |
| United Kingdom | 10.2% |
| Canada | 8.7% |
| Germany | 16.8% |
| France | 26.7% |
| Switzerland | 6.0% |
| Ireland | 10.0% |
It does not include company-specific recruiting, vacancy, attrition, and tooling costs.
Payroll TCO comparison (Mid and Senior)
| Country | Mid salary | Mid TCO | Senior salary | Senior TCO |
|---|---|---|---|---|
| US | $95,850 | $103,622 | $125,000 | $135,135 |
| Canada | C$78,000 | C$85,433 | C$114,563 | C$125,478 |
| UK | GBP 60,000 | GBP 66,815 | GBP 75,000 | GBP 84,076 |
| Ireland | EUR 50,495 | EUR 56,106 | EUR 76,430 | EUR 84,922 |
| Germany | EUR 65,000 | EUR 78,125 | EUR 80,000 | EUR 96,154 |
| France | EUR 48,000 | EUR 65,484 | EUR 63,800 | EUR 87,039 |
| Switzerland | CHF 90,000 | CHF 95,745 | CHF 100,000 | CHF 106,383 |
Add real company costs on top (Full TCO)
To get decision-grade numbers, add these components separately:
- Recruitment cost (agency/internal hiring effort).
- Vacancy delay cost (time-to-hire x monthly delivery value).
- Attrition replacement cost.
- Paid leave and non-billable capacity.
- Equipment, software, and management overhead.
Full TCO = Payroll TCO + recruitment + vacancy + attrition + leave + tooling + management overheadCountry sanity checks from official payroll sources
- United States: IRS confirms employer FICA (6.2% Social Security + 1.45% Medicare) and FUTA structure.
- United Kingdom: GOV.UK confirms employer Class 1 NI rate and thresholds.
- Canada: CRA confirms employer CPP base rate and CPP2 structure.
- Ireland: gov.ie confirms PRSI Class A employer rates by income band.
Why Salary Benchmarks Differ So Much
When comparing salary pages, teams often assume data conflicts mean “bad data.” In reality, most variation comes from methodology:
- Some sources show posted job offers, others aggregate reported compensation.
- Some use average values, others use percentiles (for example, bottom 10%, median, top 10%).
- Samples can be national, metro-specific, or platform-specific.
- Job title mapping is inconsistent: “WordPress Developer” can include anything from content-site support to ecommerce engineering.
For planning, the safest approach is:
- Use a salary range, not one single number.
- Pick the range based on ownership level, not only title.
- Add risk costs (hiring delay, attrition, leave) before final budget sign-off.
WooCommerce Premium: Why It Usually Pays More
WooCommerce roles often require deeper operational responsibility than standard WordPress work. That is why market rates tend to move toward the upper half of salary bands.
Key premium drivers:
- Revenue impact: checkout and payment failures affect revenue immediately.
- Integration complexity: payment gateways, shipping carriers, ERP and CRM sync.
- Performance under load: catalog scale, promotions, traffic spikes, cart and checkout performance.
- Reliability and incident ownership: production issues need fast debugging and business-aware communication.
If your scope includes subscriptions, multi-currency pricing, tax logic, or warehouse integrations, benchmark at mid-to-senior levels even when title says just “WordPress Developer.”
What “Entry”, “Mid”, and “Senior” Usually Means in WooCommerce
- Entry: theme edits, basic plugin setup, small bug fixes, low-risk content/ecommerce changes.
- Mid: custom WooCommerce extensions, performance work, API connections, production ownership for features.
- Senior: checkout architecture, subscription logic, ERP/CRM/fulfillment integrations, scalability, security, and incident response ownership.
If a role owns checkout, payments, or high-volume store reliability, benchmark it in the senior band.
Salary vs Real Cost: Use TCO, Not Salary Only
Salary is only the visible part of your hiring cost. For most teams, total yearly cost is materially higher after adding hiring friction and operational overhead.
Typical hidden cost buckets:
- Recruiting spend (agency fees, internal hiring time).
- Time-to-hire delay (lost delivery value while role is open).
- Onboarding and reduced early productivity.
- Attrition and replacement cost.
- Paid leave and non-billable capacity.
Simple TCO Planning Shortcut
| Component | Baseline formula |
|---|---|
| Base employment cost | Salary x 1.20 to 1.35 (depends on market and company overhead) |
| Hiring delay cost | (Months to hire – onboarding alternative) x monthly delivery value |
| Attrition cost | Expected replacements x replacement cost months x monthly compensation |
| Leave impact | Annual compensation x paid leave ratio |
How to Use These Benchmarks in a Hiring Decision
- Define ownership first: maintenance support, feature velocity, or ecommerce architecture.
- Map ownership to level (entry/mid/senior) and choose a country range from this article.
- Model TCO for 12 months using your own hiring speed and attrition assumptions.
- Compare with outsourced scenario using identical scope and delivery expectations.
- Choose model based on risk, speed, and management bandwidth, not hourly rate alone.
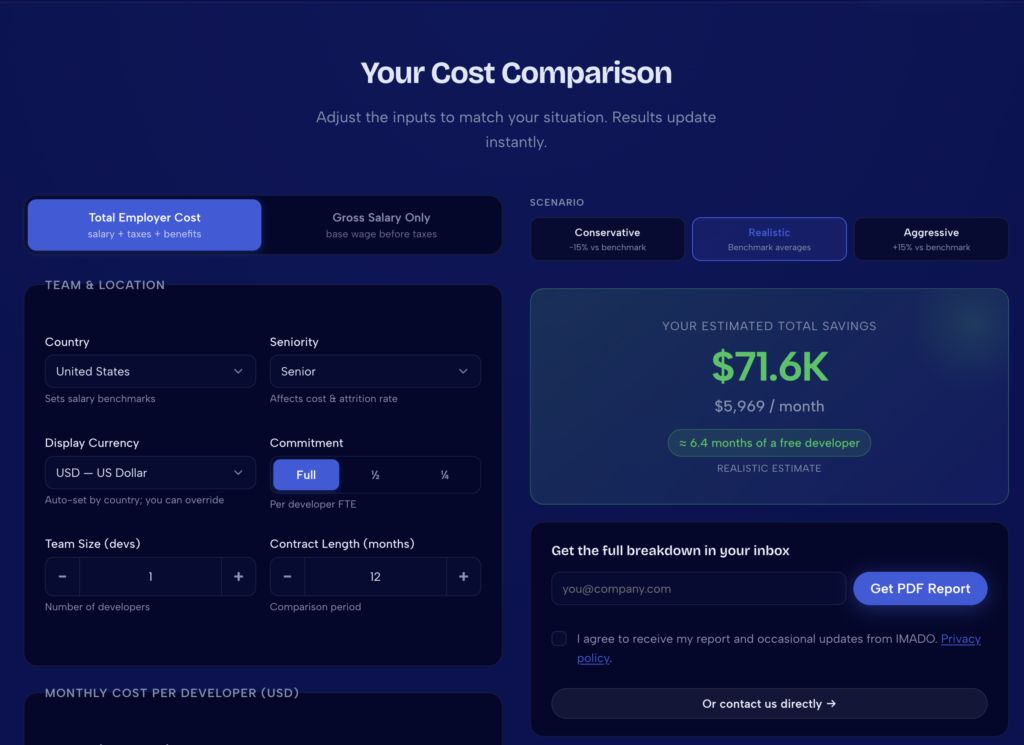
Add Your Real Numbers with the ROI Calculator
Benchmarks are useful, but your final cost depends on hiring speed, attrition, paid leave, and delivery risk.
- Compare in-house hiring vs Staff Augmentation WooCommerce team with your own assumptions.
- Estimate your real 12-month cost in 2 minutes.
Methodology and Notes
- Data collected on March 4, 2026.
- “WordPress WooCommerce developer” market data is often reported as “WordPress Developer”; WooCommerce specialization is typically represented by upper-band/senior compensation.
- Cross-country comparisons are directional due to different source methodologies, sample sizes, and local labor market structures.
Sources
- Talent.com (US)
- Talent.com (UK)
- Talent.com (Canada)
- GermanTechJobs (Germany)
- DevITJobs (France)
- SwissDevJobs (Switzerland)
- Indeed (UK)
- Indeed (Ireland)
- OECD Taxing Wages 2025 (employer SSC shares)
- IRS (US Social Security and Medicare)
- IRS (US FUTA)
- GOV.UK (National Insurance rates)
- GOV.UK (Employer thresholds 2026-2027)
- CRA (Canada payroll deductions / CPP rates)
- gov.ie (Ireland PRSI Class A rates)