


Your team launches a campaign at 9:00 a.m. Paid traffic is live. Email clicks are coming in. Sales should follow.
Instead, the site returns an error page, hangs on checkout, or stops responding from some regions but not others. Marketing sees conversion drop. Support gets messages first. Engineering finds out last.
That’s the moment WordPress uptime monitoring stops being a “nice to have” tool and becomes what it really is: a business protection system. Not because monitoring fixes outages by itself, but because it tells the right people there’s smoke before the whole building fills with it.
Table of Contents
Your Website Is Down Do You Know
A site outage rarely arrives at a convenient time. It shows up during a launch, a seasonal sale, a press mention, or right after someone approves a plugin update on Friday afternoon.
For WordPress sites, the painful part isn’t only that something broke. It’s that many teams don’t know when it broke, who noticed first, or what changed before the failure. If your first alert comes from a customer, you’re already behind.
The problem usually starts with silence
A common scenario looks like this:
- Marketing is active: Ads, email, social, and partner traffic all point to the site.
- The site appears fine internally: Someone loads the homepage once and assumes everything is healthy.
- A critical path is broken: Checkout fails, forms don’t submit, or the site times out intermittently.
- No one gets alerted: The business discovers the problem from lost leads, failed orders, or angry messages.
That’s why uptime monitoring works best when you treat it like a smoke detector, not a dashboard ornament. You don’t install a smoke detector because you enjoy alarms. You install it because delay makes every incident worse.
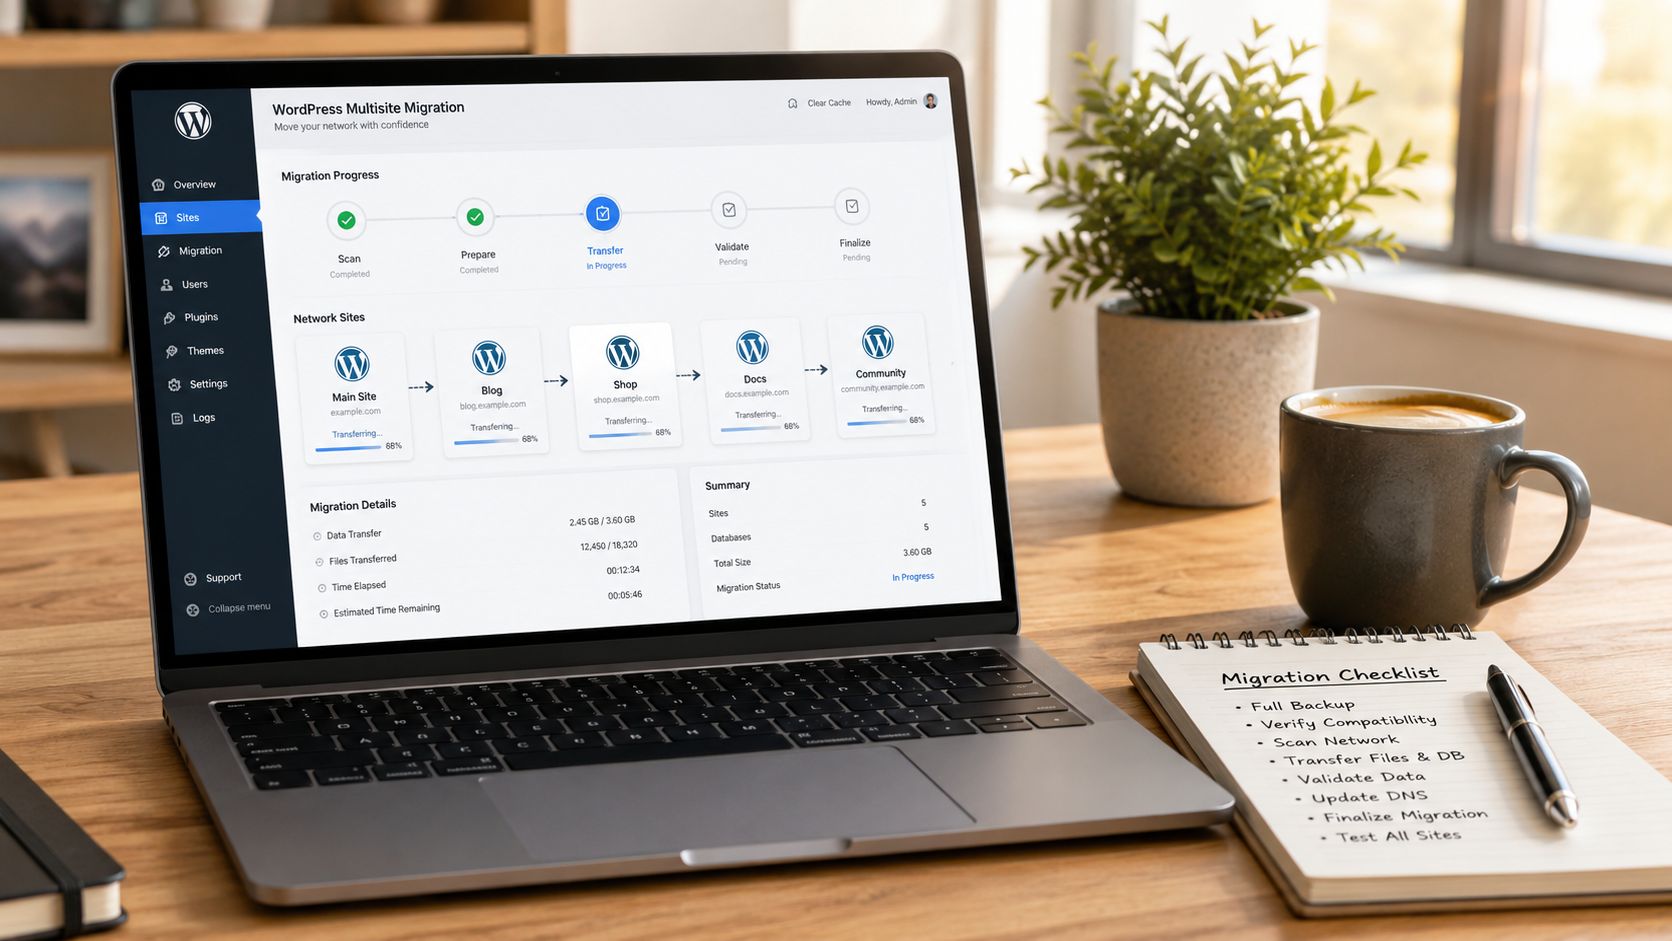
When a site has just moved hosts, this risk gets sharper. DNS changes, caching layers, SSL issues, and server configuration gaps can all create messy edge cases after launch. If you’re planning a move, a disciplined migration process like moving a WordPress website to a new host safely should always include external monitoring from the first minute after cutover.
If a website matters to revenue, lead flow, or operations, “someone will notice” is not a monitoring strategy.
The right starting point is simple. You need an external system that checks your site continuously, from outside your infrastructure, and alerts a human fast enough to act.
Why Uptime Monitoring Is Non-Negotiable
Downtime isn’t just a technical inconvenience. It affects search visibility, buyer confidence, and the numbers your leadership team cares about.
A physical store with locked doors during business hours loses sales immediately. A website behaves the same way, except the damage can be less visible at first. Traffic still arrives. Campaigns still spend money. Visitors just hit a broken experience instead of a functioning one.
Availability has a real operating threshold
According to Bandicoot Marketing’s guide to WordPress uptime monitoring, monitoring services typically check websites every 1 to 5 minutes from multiple global locations and send instant alerts when downtime appears. The same guide notes that a good uptime target for most websites is 99.9%, which means no more than about 8 hours per year of downtime.
That benchmark matters because it turns “mostly available” into something concrete. If your site falls below that standard, the issue isn’t abstract. It means users are running into outages often enough to affect business outcomes.
Three ways downtime hurts the business
Search visibility
Search engines want to send users to reliable destinations. If crawlers repeatedly encounter failures, timeouts, or unstable performance, your site becomes a worse candidate for ranking. You may not see the penalty as a single dramatic event. More often, the effect shows up as weaker visibility and less trust in the site’s consistency.
Customer trust
People don’t usually give websites many second chances. If a visitor lands on a page that won’t load, they don’t open a support ticket and wait patiently. They leave.
A homepage that loads while checkout fails is still an outage from the customer’s perspective.
That’s why teams that already invest in infrastructure resilience often pair website monitoring with broader operational planning. For a useful business-side perspective, IT Cloud Global’s IT solutions connect downtime prevention to support process, escalation, and service continuity.
Revenue leakage
You don’t need an industry benchmark to estimate the financial cost of downtime. Use your own numbers:
| Business input | What to use |
|---|---|
| Revenue window | Revenue generated during the affected period |
| Lead flow | Qualified leads usually captured in that time |
| Campaign spend | Paid traffic budget still burning while pages fail |
| Operational cost | Staff time spent triaging, communicating, and recovering |
This is why uptime monitoring belongs in the same category as backups, security controls, and change management. It protects active revenue, not just server status.
The Three Main Types of Website Monitoring
A common initial question is: which tool should we install?
The better question is: what exactly are we trying to observe?
Different monitoring methods answer different problems. If you only use one, you’ll get blind spots. The simplest way to understand them is to think about a physical store.
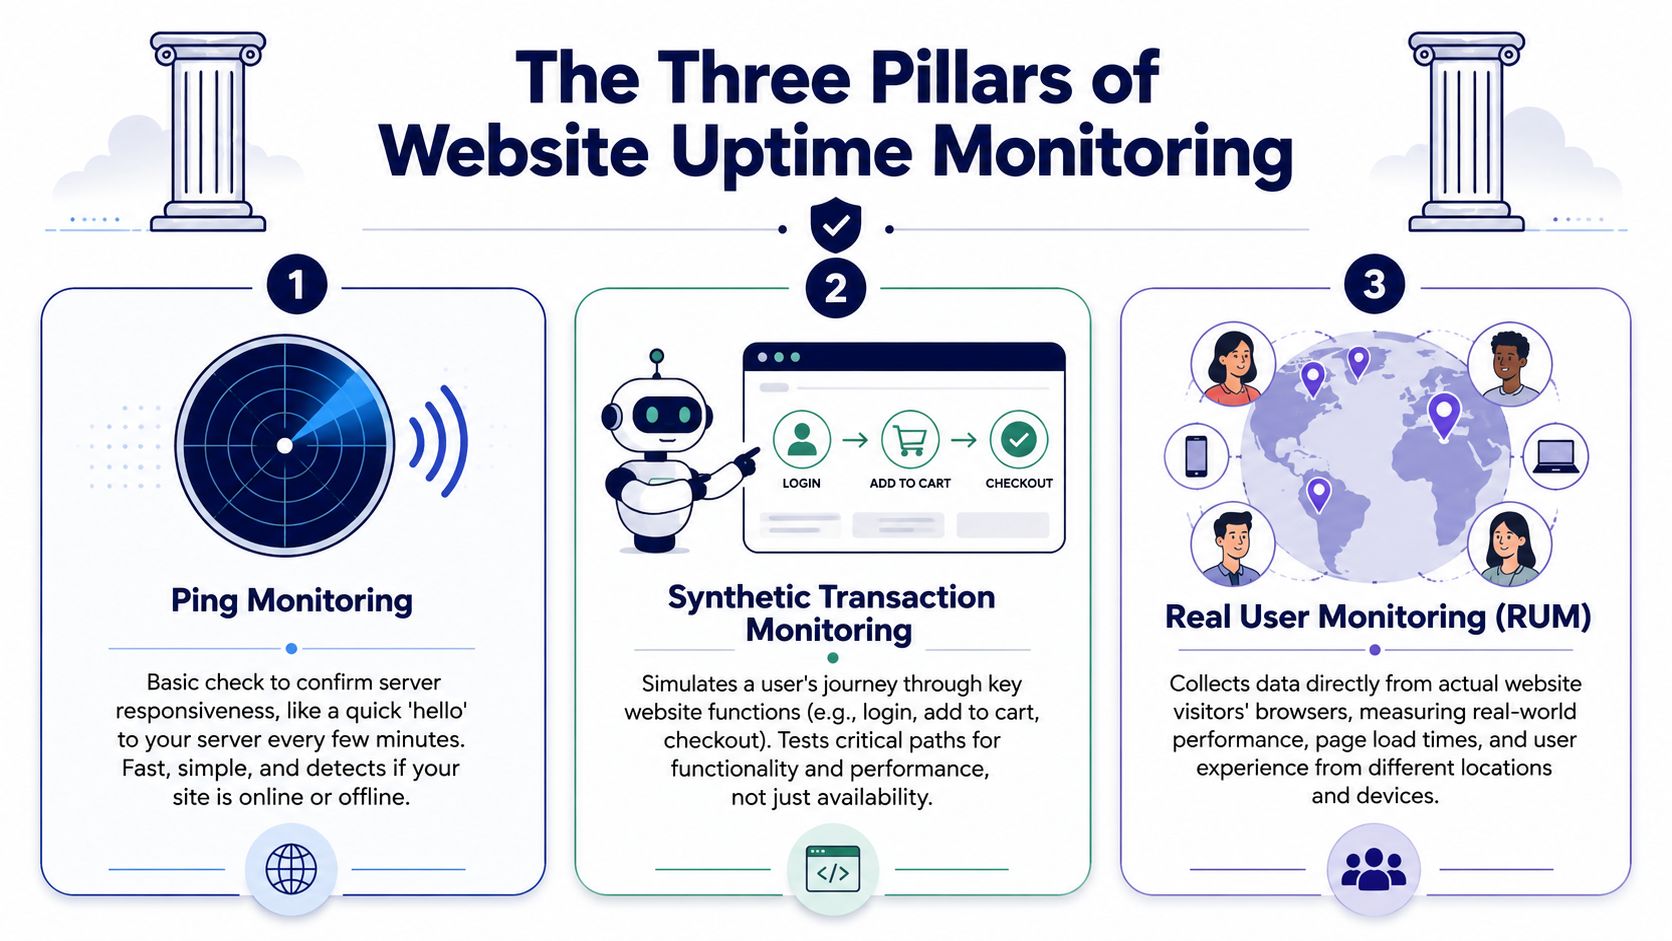
Ping monitoring checks whether the lights are on
Ping or basic uptime monitoring asks a simple question: does the site respond?
It’s the equivalent of checking whether the front door opens and the lights are on. This method is fast, cheap, and useful for catching full outages. If the server is unreachable, if the site returns an obvious failure, or if the application is completely down, ping monitoring usually catches it first.
That said, it has limits. A homepage can return a response while checkout is broken. A cached page can look healthy while logged-in users hit errors. Ping monitoring is necessary, but it’s not enough for high-stakes sites.
Synthetic monitoring acts like a secret shopper
Synthetic transaction monitoring simulates a user journey. It can log in, load a product page, add an item to cart, submit a form, or attempt checkout.
This is much closer to how a business should think about reliability. Your site isn’t “up” because the homepage responds. It’s up when customers can complete the actions that matter.
For WooCommerce, membership platforms, booking systems, and gated content, synthetic checks often provide the first useful signal. They expose failures that basic availability checks miss.
Here’s a practical way to compare them:
| Monitoring type | What it tells you | Best use case |
|---|---|---|
| Ping | Is the site reachable at all | Basic uptime detection |
| Synthetic transaction | Do key workflows actually work | Checkout, forms, login, search |
| Real user monitoring | How real visitors experience the site | Performance and UX visibility |
Real user monitoring watches the actual crowd
Real User Monitoring, often called RUM, measures the experience of people using your site in real conditions. Different devices, different locations, different browsers, different connection quality.
That matters because lab checks don’t always match customer experience. A page may pass a synthetic test from one region and still feel slow, broken, or unstable for real users elsewhere.
If you manage many domains or client properties, monitoring scope becomes part of the business model too. In adjacent service categories, how domain monitoring boosts resellers is a useful example of how proactive checks support client retention and reduce surprise failures.
Practical rule: Start with ping checks, add synthetic checks for revenue-critical flows, then use RUM when performance complaints don’t match what your uptime dashboard says.
Understanding Core Monitoring Metrics and SLAs
Monitoring tools generate lots of graphs. Most of them don’t matter during an incident.
The metrics that matter are the ones that help you answer three questions fast: Is the site available? Is it fast enough to use? Who is accountable if it isn’t?
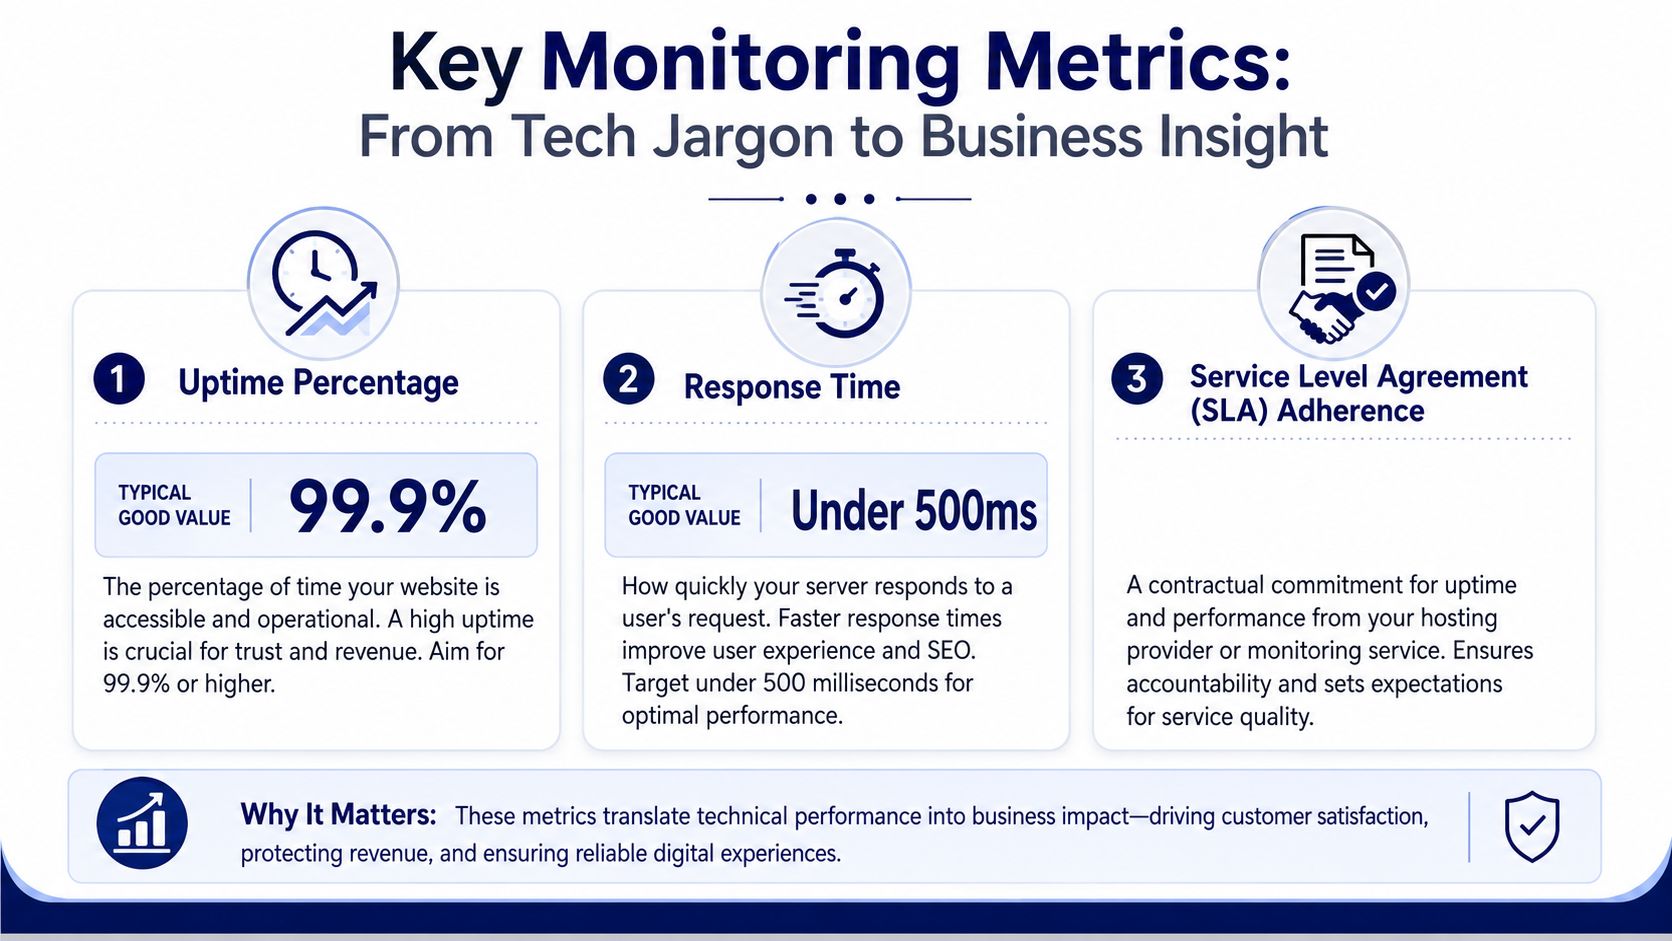
Uptime percentage tells you reliability over time
The most important metric is uptime percentage. According to UptimeRobot’s WordPress uptime monitoring guide, uptime percentage is the foundational metric, and 99.9% is a strong benchmark. That means a WordPress site can be down for only about 8 hours annually.
Teams often overestimate reliability. “It was only down briefly” sounds minor until those incidents accumulate across launches, updates, and traffic peaks.
If a report shows strong uptime over time, that’s a sign your stack and processes are stable. If it doesn’t, don’t treat the number as a vanity metric. Treat it as evidence that users are encountering avoidable friction.
Response time shows whether the site is degrading before it fails
A site can be technically online and still unusable. That’s where response time matters.
When response time worsens, visitors feel the slowdown before your uptime percentage takes a hit. Product pages stall. Admin screens lag. Checkout becomes frustrating. Search and account actions start timing out under load.
Watch for patterns, not isolated blips:
- After deployments: New code, plugin changes, and configuration edits often show up here first.
- During campaigns: Traffic spikes expose hosting, database, and caching weaknesses.
- By region: A site may feel healthy in one geography and poor in another.
Slow is often the warning phase before down.
SLA language matters only if your alerts and operations support it
An SLA is a service commitment from your provider. It sets expectations around uptime and, in some cases, support response.
But an SLA doesn’t replace your own monitoring. Providers measure from their side. You need external visibility from yours. UptimeRobot’s guide also notes that effective monitoring strategies include alerts through channels like email, SMS, and Slack, so critical failures reach the right people quickly. For teams that need ongoing operational coverage, structured WordPress website maintenance plans are often what turns monitoring data into actual response discipline.
A simple way to read a monitoring report is this:
- Uptime percentage answers whether the site stayed reachable.
- Response time answers whether it stayed usable.
- SLA alignment answers whether your vendors are meeting the service standard you expect.
If one is healthy and the others aren’t, you still have a business problem.
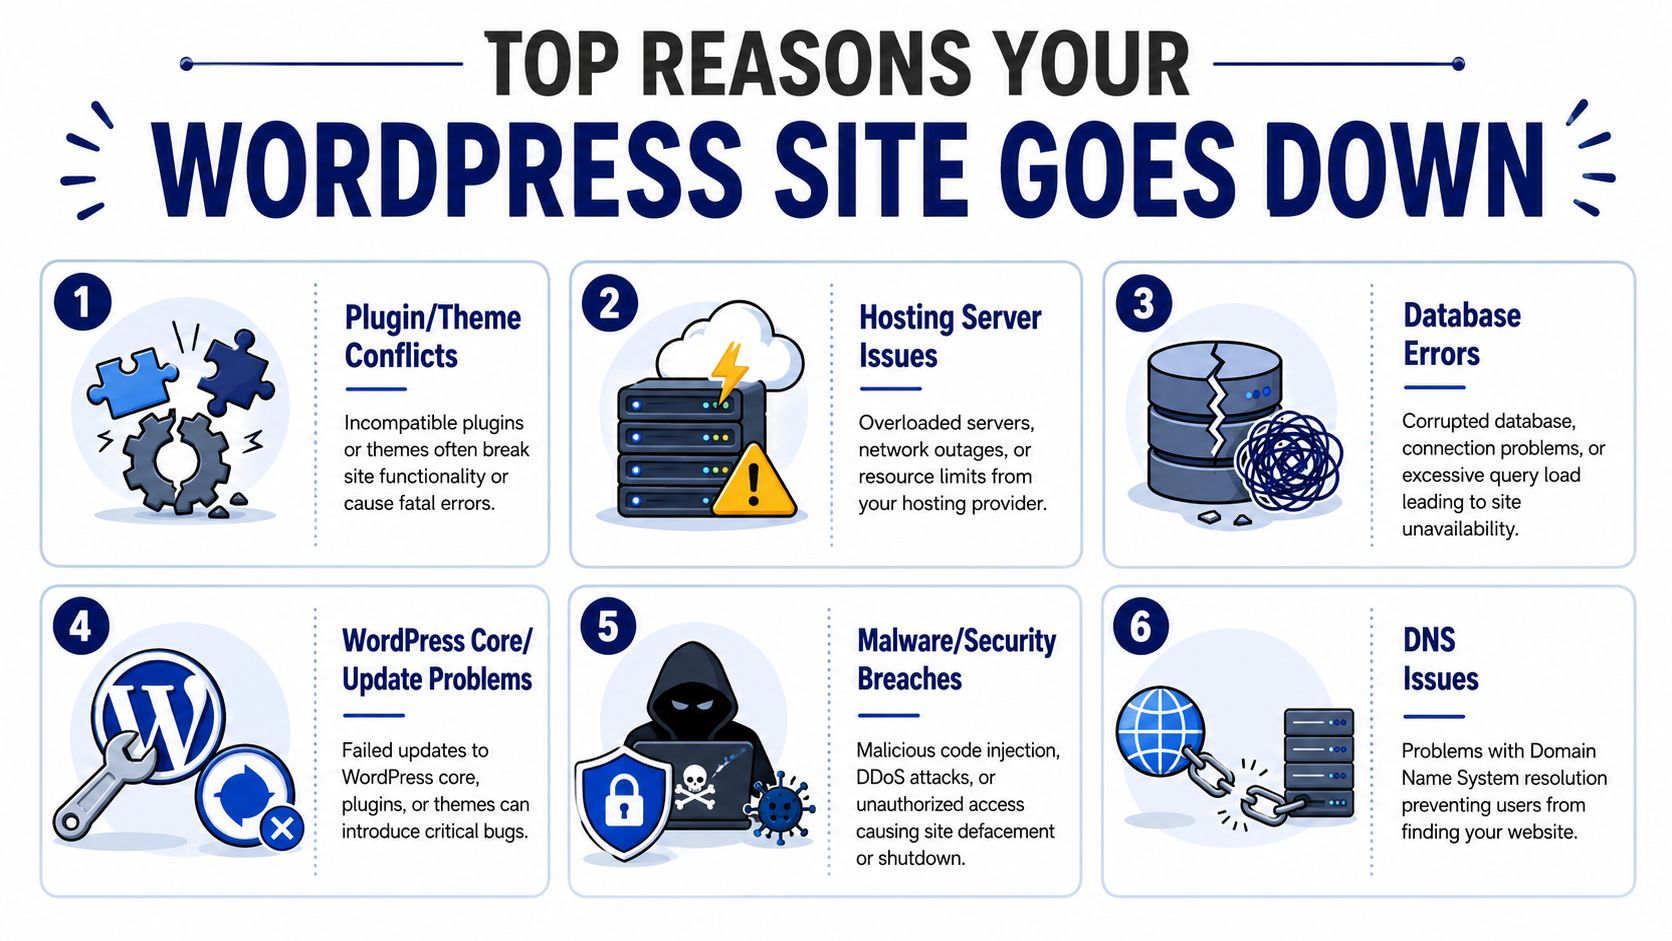
Common Causes of WordPress Site Failures
Most WordPress outages aren’t random. They come from a predictable set of failure points.
That’s good news. Predictable failures can be prevented, tested, and contained.
Software conflicts are still the classic offender
WordPress gains flexibility from themes, plugins, and custom code. That same flexibility creates risk.
A plugin update can conflict with another extension. A theme override can break after a core change. A custom snippet that worked in staging can fail under production conditions. These issues often appear as white screens, admin lockouts, broken forms, or partial rendering problems.
Hosting and database issues create invisible instability
Not every outage is a dramatic server crash. Many start as resource pressure, poor configuration, or database trouble.
A hosting problem may present as sporadic slowness, intermittent errors, or regional inconsistency. Database issues can be even more disruptive because they break the application at its center. If your site has ever shown the dreaded connection error, this guide to fixing the error establishing a database connection in WordPress explains the mechanics behind one of the most common failure modes.
Third-party dependencies and human error finish the job
WordPress sites rarely operate alone. They depend on payment gateways, search tools, CRMs, CDNs, APIs, email services, and DNS providers. If one of those services misbehaves, your users often blame your site anyway.
Common triggers include:
- Failed updates: WordPress core, plugin, or theme updates that complete partially or introduce regressions
- Security incidents: Malware, abusive traffic, or unauthorized changes that destabilize the site
- Deployment mistakes: Wrong environment variables, bad code pushes, or missed dependency checks
- DNS or certificate problems: The app may be healthy while users still can’t reach it securely
A practical reliability mindset is to assume that every one of these will happen eventually. Teams get into trouble when they treat them as rare surprises instead of routine operational risks.
Building an Effective Alerting and Response Strategy
Monitoring without response planning creates a new problem: noise.
If every alert is urgent, people stop trusting alerts. If alerts arrive with no runbook, teams waste time deciding what to do while users keep hitting errors.
Good alerting is tiered not loud
A professional setup separates warnings from incidents.
A minor response time increase might go to email or Slack for review during working hours. A confirmed outage on checkout, login, or lead capture should reach the on-call person immediately through a stronger channel. The goal isn’t more notifications. The goal is useful urgency.
A practical alerting model looks like this:
| Alert level | Typical channel | Example trigger |
|---|---|---|
| Informational | Dashboard or email | Minor degradation trend |
| Warning | Slack or team chat | Repeated slowdown or error spike |
| Critical | SMS, phone, or paging tool | Confirmed outage on key journey |
Every serious site needs a runbook
A runbook is just a documented first response checklist. It keeps teams from improvising badly under pressure.
Include the basics:
- Acknowledge the alert so others know someone is handling it.
- Verify externally from more than one location or service.
- Check recent changes such as plugin updates, deployments, DNS edits, or host changes.
- Review the blast radius by asking what’s affected: homepage, admin, checkout, forms, API, or a single region.
- Escalate fast if the owner can’t restore service promptly.
The best runbooks are short enough to use under stress and specific enough to prevent confusion.
Write the runbook before the incident. During the incident, nobody writes clearly.
The response process should include security thinking
Not every outage is a performance problem. Some are security incidents in disguise.
If you see suspicious behavior, unauthorized changes, unusual redirects, or signs of compromise, your response should shift from pure restoration to containment and investigation. For teams dealing with that scenario, InsecureWeb’s advice on data breaches offers a useful parallel checklist for what to do once the issue may involve exposure rather than simple downtime.
One more point matters here: post-incident review. After recovery, capture what happened, what triggered it, how long detection took, and what should change. That’s how you reduce repeat incidents and avoid alert fatigue. Without that loop, monitoring remains reactive noise instead of an improving operational system.
Beyond Monitoring The Role of Proactive Maintenance
Monitoring tells you when something is wrong. It doesn’t stop the problem from happening.
That’s the limit of every uptime tool. It’s reactive by design.
A mature WordPress reliability practice uses monitoring as one layer inside a broader maintenance system. Updates are tested before rollout. Plugins are reviewed for quality and overlap. Performance bottlenecks are found before campaigns expose them. Security controls reduce the odds of compromise. Backups are verified, not assumed.
Monitoring is the seatbelt
Think of monitoring as the seatbelt in a car. You absolutely want it. It limits damage when something goes wrong.
But what prevents the crash is a different set of disciplines: good maintenance, careful driving, routine inspection, and catching faults early. On WordPress, that means managed updates, plugin governance, database care, hosting oversight, incident runbooks, and regular performance review.
Serious sites need a maintenance posture not a plugin habit
A lot of teams approach WordPress uptime monitoring as a shopping exercise. Which plugin? Which dashboard? Which alert app?
That’s too narrow for sites tied to revenue, lead generation, publishing operations, or client delivery. A key question is whether someone is actively managing the site’s reliability. If not, the stack slowly accumulates risk until one change pushes it over the edge.
Ongoing WordPress maintenance and support proves more valuable than any single monitoring tool. It connects updates, performance, security, and incident handling into one operating model.
The practical takeaway is simple:
- Monitoring detects
- Runbooks coordinate
- Maintenance prevents
If your site matters, you need all three.
If your team needs senior-level help with WordPress reliability, performance, migrations, maintenance, or white-label engineering capacity, IMADO provides the kind of structured WordPress support high-stakes sites need. They help organizations move beyond basic alerts and build resilient systems that protect revenue, SEO, and day-to-day operations.